Total Access Analyzer: Database Analysis You Can Trust
MS Office and VB for Applications Developer
January 1998, by Thomas Wagner
How do you improve on a great product? FMS, Inc.'s Total Access Analyzer (TAA), in its previous incarnation for Access 2.0, was a tour de force. So is it really possible for it to get any better? Especially since Access 97 is very different from its 16-bit predecessor? These were just some of my questions as I ripped open the box for TAA 8.0. As I discovered, TAA is a unique tool. If you want to know everything there is to know about your Access database - and I do mean everything - use TAA.
Analysis and Documentation
As in previous releases, TAA continues to deliver two distinct, but related, sets of functionality: analysis and documentation. Analysis is necessary before any formal documentation is output:
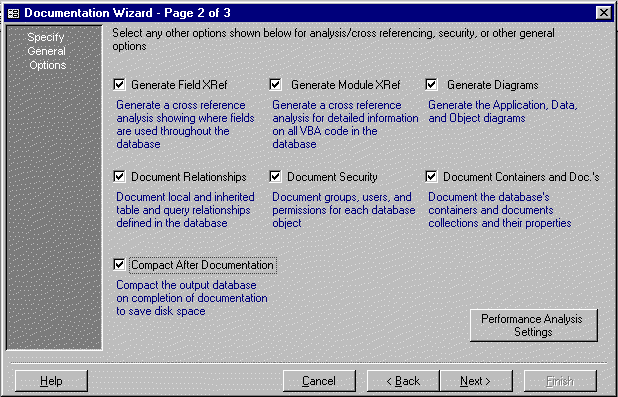
Figure 1: Selection options available before the start of a
documentation session.
TAA is, without a doubt, the quickest way to become familiar with another programmer's Access database work. Unless you like sifting through code one line at a time, the ability to generate a complete breakdown, including cross-indexed code and application diagrams, can prove invaluable. In addition to the diagrams that can lead an uninitiated programmer through the complexities of another person's work, the analysis phase of TAA can also help pinpoint trouble areas of an application. For a list of potential problems it can bring to light, see the sidebar.
After completing the analysis phase, TAA offers its users a repertoire of over 220 reports. Printing all these for a single database documentation session could certainly be considered an environmental offense because of the amount of paper used - and I'm only half kidding. Luckily, a user can filter the output of the analysis to present certain aspects of the flood of information generated by TAA. For example, it's possible to print only the documentation that pertains to forms. In addition, thanks to the new Explorer-like user interface, most of the information presented by these reports can be viewed on screen, quickly and efficiently, as a hierarchical node:
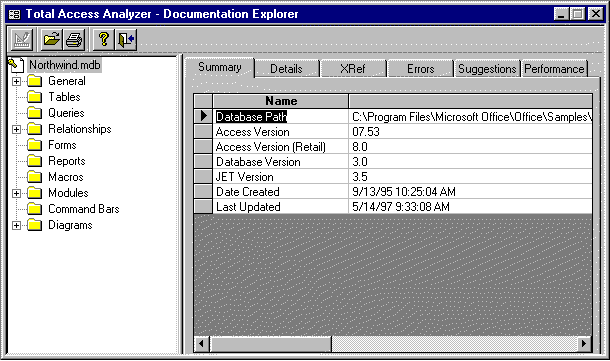
Figure 2:The Explorer-like interface allows for quick viewing of specific analysis findings.
Reports
Most Access database documentation tools on the market are able to deal with certain objects within the database structure rather easily. For example, most of them can handle tables, queries, and macros. TAA stands far above its closest competitor by providing reports such as the Form Blueprint, Report Blueprint, and Relationship report. In the case of Form and Report Blueprints, it generates reports that show the layout of the form in question, optionally cross-referencing and numbering the controls in the design process.
The Relationships window graphically illustrates the contents of the Access relationship window much the same as the window appears:
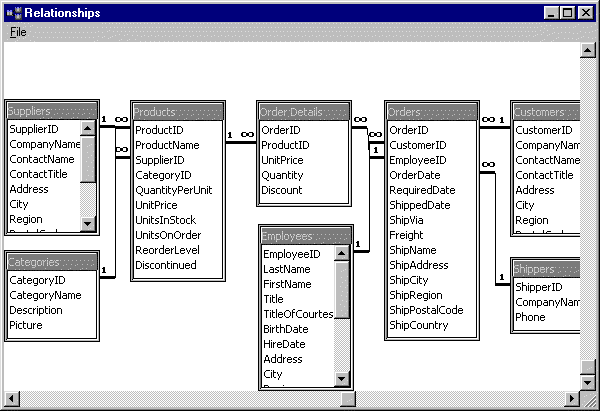
Figure 3: Example of the Relationships window output.
In other words, this report is a close visual representation of the contents of the Access relationship window. Considering how relationships in Access can be defined in almost "free-form" fashion, the TAA Relationship report is a noteworthy technical achievement.
In addition to the blueprint reports, TAA offers two major cross-reference reports. The Field XRef report illustrates where fields are used in queries, tables etc. It allows you to quickly see which objects may be affected by a change at the field level of the database (i.e. renaming a field). The Module XRef report is completely independent of the basic module documentation. The basic module documentation is used to print the contents of a module, while the Module XRef is used to categorize the report on the VBA module structure itself, including definitions, procedure calls, constants and variable declarations, function calls, and much more. Again, these reports can be previewed on screen or printed, or their data viewed via the Explorer.
The diagram output offered by TAA spans several useful categories:
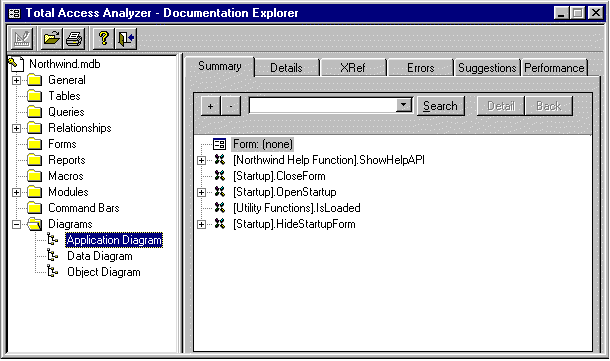
Figure 4: The diagram output offered by TAA.
First and foremost, the Application Diagram shows the flow of a database application in a hierarchical fashion. That is to say it provides a step-by-step illustration of an application's flow. Secondly, the Data Diagram reports which objects use which tables and queries. For example, it allows the user to quickly identify all objects within the database that are dependent on table x. Lastly, the Object Diagram illustrates all tables and queries referenced by any form, query, or macro.
One important question may have come to mind: Do you need to run this super sleuth every time you want to print a simple table structure? The answer is no. To take advantage of the features offered by TAA, without the overhead of a full-blown documentation session, FMS has created the QuickDoc option. By using QuickDoc, it's possible to efficiently generate selected reports on specific database objects. It's one of my favorite ways to print my modules.
Performance Improvements and Suggestions
TAA offers a number of suggestions in response to its analysis findings:
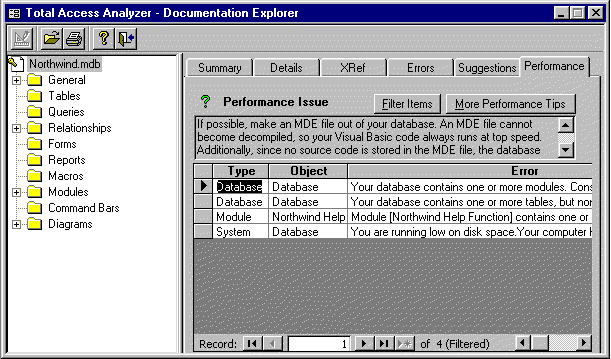
Figure 5: Performance tips offered by TAA after analyzing the Access sample database.
These suggestions typically deal with changes that create a more efficiently working database. Similar to the Performance Analyzer that ships with Access 97, but with a great deal more information and direction, the suggestions offered by TAA have been derived from the experience of the developers at FMS. During a series of tests, I found some of these suggestions, as well as some of the errors identified by TAA, to be a little generic (in the sense that this computer analysis tool does not understand my intentions when writing code). At the same time, I would much rather work with a utility that identifies too much information than one that doesn't determine enough problems, bottlenecks, and oversights. (Of course, none of us have any such problems - right?)
In addition to the specific performance issues listed for a particular documentation session, users can review the performance tips database and read various other tips, much the same way one would use a knowledge base:
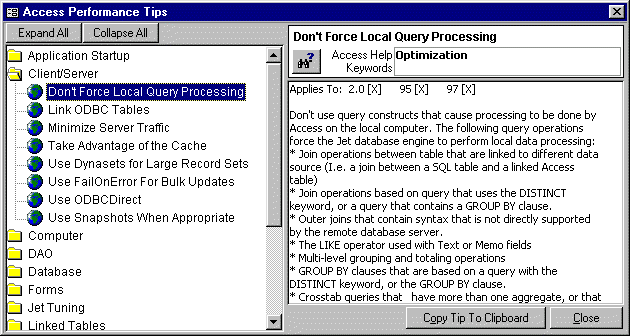
Figure 6: The Access performance tips.
It's the Small Things
A contributing trademark of good software is the way it handles details. If the development team has done its homework, there are usually a number of small features - easy to dismiss and overlook - that, taken as a whole, make the product much better. TAA is no different in this regard. Small details, additional features, and amenities are found in various areas and contribute to a pleasant working experience.
If this is your first exposure to TAA, it won't make much difference for me to describe how nice the new Explorer-like interface is. For those of you who have worked with previous incarnations of TAA, suffice it to say that FMS has completely re-styled the user interface. The result is a faster, more open feel. An amenity - one that becomes more important as the projects I want to analyze get bigger and bigger - is the ability to schedule the generation of documentation. Considering how much information is produced by TAA, some sessions can take a long time - especially those involving blueprints of forms or reports. By scheduling them to run at night, I'm not wasting any working hours.
Other details I've come to appreciate are the ability to influence how the reports look in terms of consistent headers, dates, etc., as well as the various methods of printing modules that are offered by TAA. A user can specify the look of comments versus the look of actual code, and include visual indicators that tie together the various parts of loops and IF statements via printed brackets. One small feature that shows the experience of FMS in the third-party database add-in market is the ability to specify what settings constitute a "normal" scenario in the performance analysis section of TAA. There are defaults that have been defined by FMS. However, any user can adjust them to profile the performance analyzer more closely with a particular working environment.
Conclusion
When reading trade magazines, I always look for one particular distinction in a product review: experience. Is a review written by a technical author whose primary job is writing, or has it been written by a person who actually works in the field? I'm probably not alone in this approach. For that reason, I'd like to mention that I have used Total Access Analyzer with great success in my professional practice. It has helped when personnel changes occurred in the middle of projects and threatened to throw things into chaos; it has helped from a Quality Assurance standpoint; and it has helped by allowing me to provide good customer service to my clients. If I were to buy only one add-in for Access 97, this would be the one. It's an investment that has paid off very handsomely.
Thomas Wagner is a Senior Consultant with Enterprise Technology Partners, a Southern California consulting a d training company specializing in Microsoft Access, Visual Basic, C++, Microsoft SQL Server, Microsoft Office, and various Internet Technologies. He is co-author of The Visual Guide to MS Access [Ventana, 1995], as well as technical editor of several other publications.
Microsoft Access 2019 / 365 Version is shipping!
Version 16.7 for
Microsoft Access 2016
Version 15.7 for
Microsoft Access 2013
Version 14.7 for
Microsoft Access 2010
Version 12.97 for
Microsoft Access 2007
Version 11.95 for
Microsoft Access 2003
Version 10.8 and 9.8 for
Access 2002 and 2000
Awards and Reviews
"Total Access Analyzer is an amazing product that I've relied on and recommended for years. It's a huge time saver."
Sal Ricciardi, Programming Writer, Microsoft Corporation
Analyzer Info
Why Analyzer?
Additional Info


