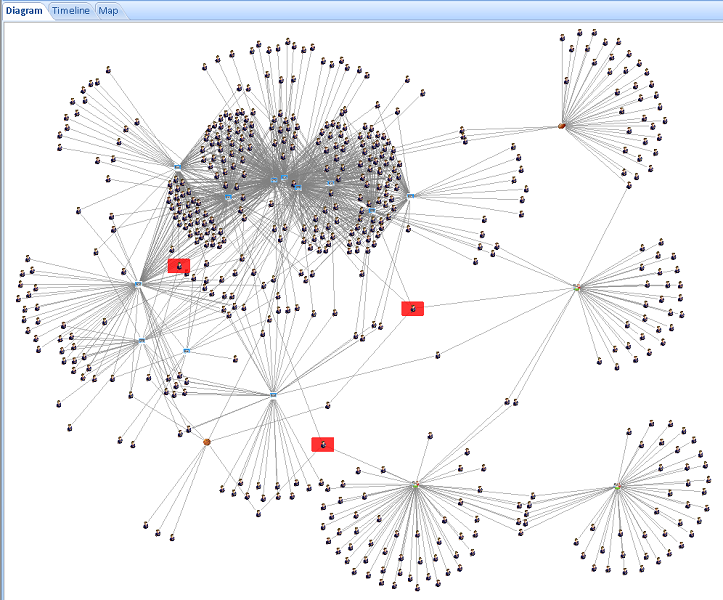
The FMS Advanced Systems Group, a division of FMS, develops data analytic and visualization tools for mission critical environments. After years of creating custom solutions and learning from real-world scenarios, we are pleased to introduce Sentinel Visualizer.
Sentinel Visualizer is a commercial, off-the-shelf software product that brings the power of data visualization, link analysis, geospatial, timeline, and Social Network Analysis (SNA) to the general public. Apply this cutting edge technology to better understand your data and improve your decision making.
Store massive amounts of information, then discover hidden relationships and connections that are nearly impossible to find in traditional rows and columns. Entities can be people, places, events, emails, phone numbers, IP addresses, hardware, etc. Relationships are what connects the entities to each other (parent/child of, employee of, emailed to, flew on, called, attended, etc.):

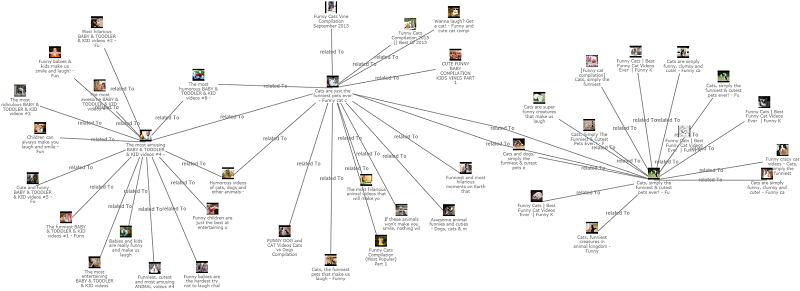
Easily see multiple levels of links and cross-links as you click deeper into your network. Connect-the-dots and gain insight into what's really going on. Easily filter your data based on entity or relationship characteristics. Most importantly, everything is a probability and can be weighted to better reflect the world you're modeling. For instance, a brother relationship may be considered more important than two people who attended the same conference.
 Contact Tracing is critical to minimizing the spread of COVID-19 in the community.
Coronavirus infections are particularly dangerous to vulnerable populations such as retirement homes, elderly family members, medical providers, and front-line service personnel.
Sentinel Visualizer helps you collect and analyze the data of your population so you are prepared when an outbreak occurs. Quickly isolate and quarantine people in contact with infected individuals and minimize the transmission of this highly contagious disease.
See the connections between entities with multiple formats including link charts, geospatial views, timelines, and 3D displays:
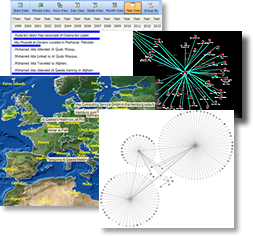
For instance, you can use this for general law enforcement investigations or to analyze telephone call data records (CDR) to prioritize entities warranting additional attention.
Automatically apply the science of Social Network Analysis (SNA) to instantly identify key points by a variety of criteria such as degrees, betweeness, centrality, eigenvalue, authority, hub, etc.
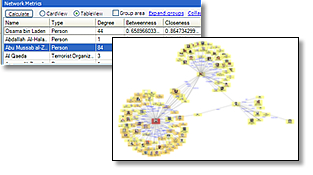
Here's more information on our Social Network Analysis software.
Sentinel Visualizer includes a powerful, open, and configurable knowledgebase that makes it easy to store any information: text, graphics, documents, video, audio, etc. Move beyond simple "cards" with a flexible multi-user data repository that is directly integrated with visualization and analysis tools.
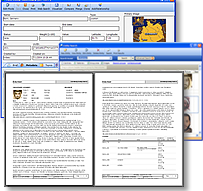
You can store all sorts of information on each entity and relationship. Additionally, there's support for metadata fields with optional lookup lists that you define to extend the fields you can store. Multi-user support allows each analyst to provide and share their findings with others in a collaborative setting.
Sentinel Visualizer is available in three versions with increasing functionality:
Standard Version
Powerful link analysis and visualization for single users
Professional Version
Adds geospatial tools including integration with Google EarthPremium Version
Adds workgroup multi-user database access
Visit the Sentinel Visualizer Pricing and Editions page for details.
Support Subscriptions
The Annual Support Subscription provides for the year:
- All updates and upgrades
- Priority telephone support
- Priority email support
 Written in Visual Studio .NET, Sentinel Visualizer is a Windows based application that stores its data in Microsoft SQL Server, an industry standard, non-proprietary database that is highly scalable and extensible.
Sentinel Visualizer can connect to a local SQL Express database on your PC, a shared server securely hosted behind your firewall, or a cloud based instance of SQL Server such as those hosted on Microsoft Azure.
Easily migrate local databases to the Microsoft Azure cloud and vice versa.
 For more information on how Sentinel Visualizer uses SQL Server databases, visit
Migrate a Sentinel Visualizer Database to Microsoft Azure.
Enterprise solutions with a web interface are supported on a custom basis. Contact us for more information.
Sentinel Videos
"Sentinel Visualizer is robust enough to handle complex and meaningful link and social network analyses over complex data, yet intuitive enough to be immediately accessible."
J. Adams, Eastport Analytics
Additional Info


