Supports Microsoft Visual Basic 6.0 (VB6)
"The application is great! It is relatively easy
to use and is great for developing programs in VB6 that require
statistical calculations."
Dan Biscoe
Check for Updates
License Terms

|
|
Product Guide for Total VB Statistics for VB6
Total VB Statistics offers a wide range of statistical functions for
Visual Basic programmers using Microsoft Jet Engine databases. Any
Access/Jet table or linked table such as SQL Server, dBase, or Paradox table
can be analyzed. Multi-table Select Queries can also be analyzed. An
unlimited number of records can be analyzed.
Developed specifically for Visual Basic programmers, Total VB Statistics
eliminates the need to export your data to other programs for statistical
analysis. You can perform a wide range of statistical functions with all
results in Microsoft Access tables. View, sort, query, or display the
results. You can also add it to reports just like any other table.
Total VB Statistics includes two parts. The first is an interactive
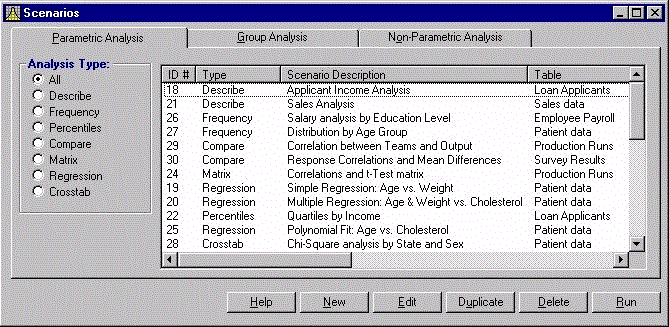
Statistics Scenario Designer. This standalone program lets you easily
specify the database, data, fields, and analysis to perform. The second part
is an ActiveX DLL component that performs the analysis. This file, under 1
Meg, is the only file you need to include with your VB applications to add
statistical analysis.

The Total VB Statistics Scenario Designer
Features
- Statistically analyze data from any Jet Database or linked table
- Analyze multi-table Select queries
- Analyze an unlimited number of records
- All output in Jet tables
- No programming required to specify the analysis to perform
- Analysis settings are saved as "scenarios" which can be run again in the future
- Analyze multiple fields at one time
- Use data grouping fields to analyze groups of records (optional)
- Weight data based on a weighting field's value (optional)
- Ignore a numeric value or range of values (optional)
- Programmatic interface to add statistical analysis to your applications
- Includes a royalty-free runtime license
- Scenarios are compatible with
Total Access Statistics.
Scenarios created in either program can be run by the other.
Calculations available in Total VB Statistics
- Count, Missing (blanks), Mean.
- Minimum, Maximum, Range, Sum, Sum of Squares.
- Variance, Coefficient of Variance, Std. Deviation, Std. Error.
- Geometric Mean, Harmonic Mean, Root Mean Square.
- Skewness, Kurtosis.
- Mode, Mode Count.
- t-Test versus Mean (test for null hypothesis).
- Confidence Intervals (t and Normal tests). 95% and user-specified levels.
- Percentiles: median, quartiles, deciles, and percentiles.
- Frequency distribution with user-specified group width, initial value
and number of intervals. Display count, percent of total, sums and
cumulative values.
- Mean difference
- Standard Deviation of difference
- Covariance
- Correlation
- R-Square
- Paired t-Test
- Probability (1 or 2 tails).
- Simple, Multiple and Polynomial (up to 9th order).
- With Y-Intercept or Zero-Intercept.
- Count, Missing, R-Square, Std. Error of Est., and ANOVA
- Coefficient analysis: P Std. Error, Beta, t-Value and Probability.
- Residual calculation for each data point.
- 10 types: Count, Sum, Average, Minimum, Maximum, Range, Variance,
Coefficient of Variance, Std. Deviation, Std. Error.
- Count crosstabs for Text and Date value fields.
- Row total and Column sub-totals.
- Percent of Column, Row and Total.
- Sorted column fields with special handling for blank values.
- Chi-Square Analysis: Chi-Square, Probability, Cramer's V,
Phi-Coefficient, Coefficient of Contingency.
- Two-Sample t-Tests (pooled and separate variance tests).
- ANOVA (Analysis of Variance) with sum of squares, F-Value and
probability.
- One sample Chi-Square
- One Sample Sign Test for Median and Mean
- Two Sample Sign Test for Equal Median.
- Kolmogorov-Smirnov Goodness of Fit Test
- Paired Sign Test, Spearman's Rho Correlation
- Wilcoxon Signed Rank Test for Matched Pairs
- Wald-Wolfowitz Runs Test
- Mann-Whitney U Two Sample Test
- Kolmogorov-Smirnov Two Sample Test.
- Correlations: Spearman's Rho and Kendall's Tau.
- Kruskal-Wallis One Way Analysis of Variance.
- Friedman's Two Way Analysis of Variance.
- Evaluate probability of test values: Z, t, Chi-Square, and F.
Enter the test value and degrees of freedom to see the corresponding
probability.
- Calculate inverse probability. Enter a probability and calculate the
equivalent Z, t, Chi-Square, and F value.
- Eliminate interpolating values in reference tables.
Pricing and Licensing Information
Total VB Statistics is available on a per developer basis and
includes unlimited, royalty free distribution rights for that
developer. It supports Visual Basic 6.0.
|
|


